
Steam Machine: Between 12k and 15k Sold per week
Valve is a fairly secretive company when it comes to how they perform: they have never published quarterly hardware sales figures for its consumer devices. They don’t track them in press releases, they don’t have earnings calls since they remain a private company, and they don’t treat unit volume as a front and center KPI on the store.
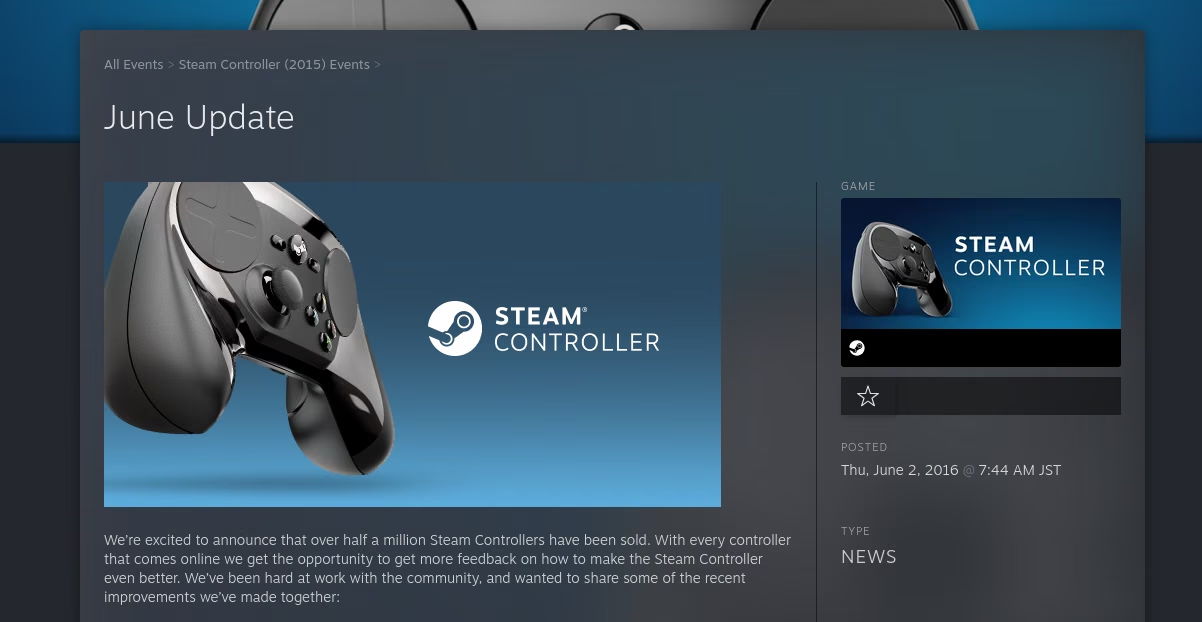
There is maybe one exception: a few years back, they did announce that they had sold 500k Steam controllers. That was actually just 10 years ago!
At the same time, they do like to share a lot of data. They have hardware surveys, weekly best sellers, and also real-time revenue data: the Global Top Sellers chart.
Because that chart ranks products by gross financial throughput rather than unit count, it creates a bias we can exploit to do some napkin math estimations. High-priced hardware requires significantly fewer transactions to occupy a higher chart position, compared to low-priced software or microtransaction-driven titles.
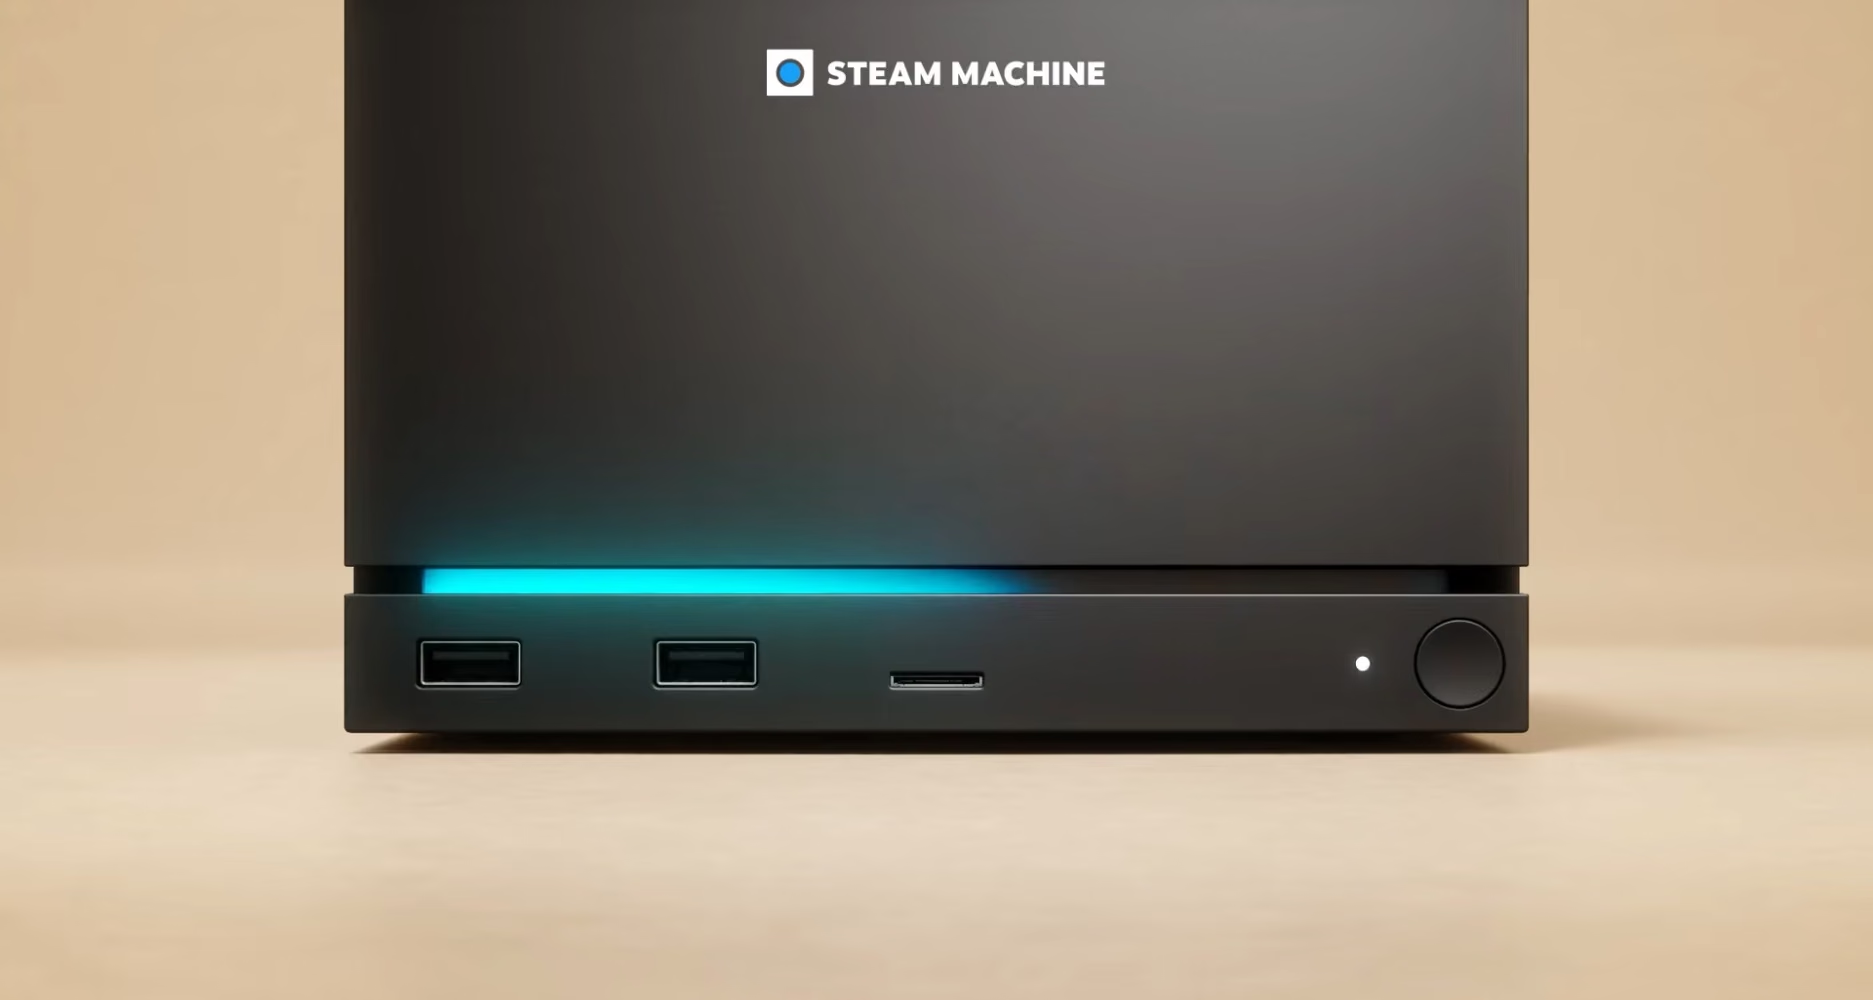
So we can do some some estimations by calculating revenue boundaries surrounding the 2026 Steam Machine‘s current second global placement. Our tracking projects that Valve is moving approximately 12k to 15k units per week during this launch window. That’s on July 18th 2026, this is very likely going to change as time passes, in one way or another. But this is as close as we can be to the launch window at the moment and Valve’s top seller figures.
Now if you want to go beyond the headline, continue reading below to understand where this is coming from.
Deciphering the top sellers chart
To model unit sales from Steam’s Global Top Sellers list, you first have to understand how Valve aggregates and weights revenue. This is based on Valve’s own explanation.
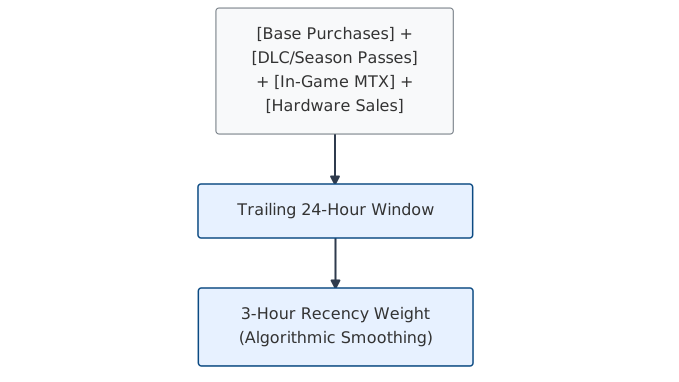
The chart operates on a rolling 24-hour window, but it’s not a linear average. Valve applies heavier weight to transactions occurring within the most recent three hours to capture launch spikes and flash sales without lagging behind real-time changes in demand. More importantly, every dollar is treated identically. A 10 dollars indie game, a 5 dollars CS2 case key, and a 1349 dollars Steam Machine occupy the same space. This revenue equalization means that hardware doesn’t need to outsell software by volume. it only needs to match its financial output. This is well known if you are familiar with this chart.
The Revenue Bounding Box
Today’s timepoint is extremely convenient, because the Steam Machine is in 2nd position, which means we can derive a clear bounding box for where it stands in terms of sales.
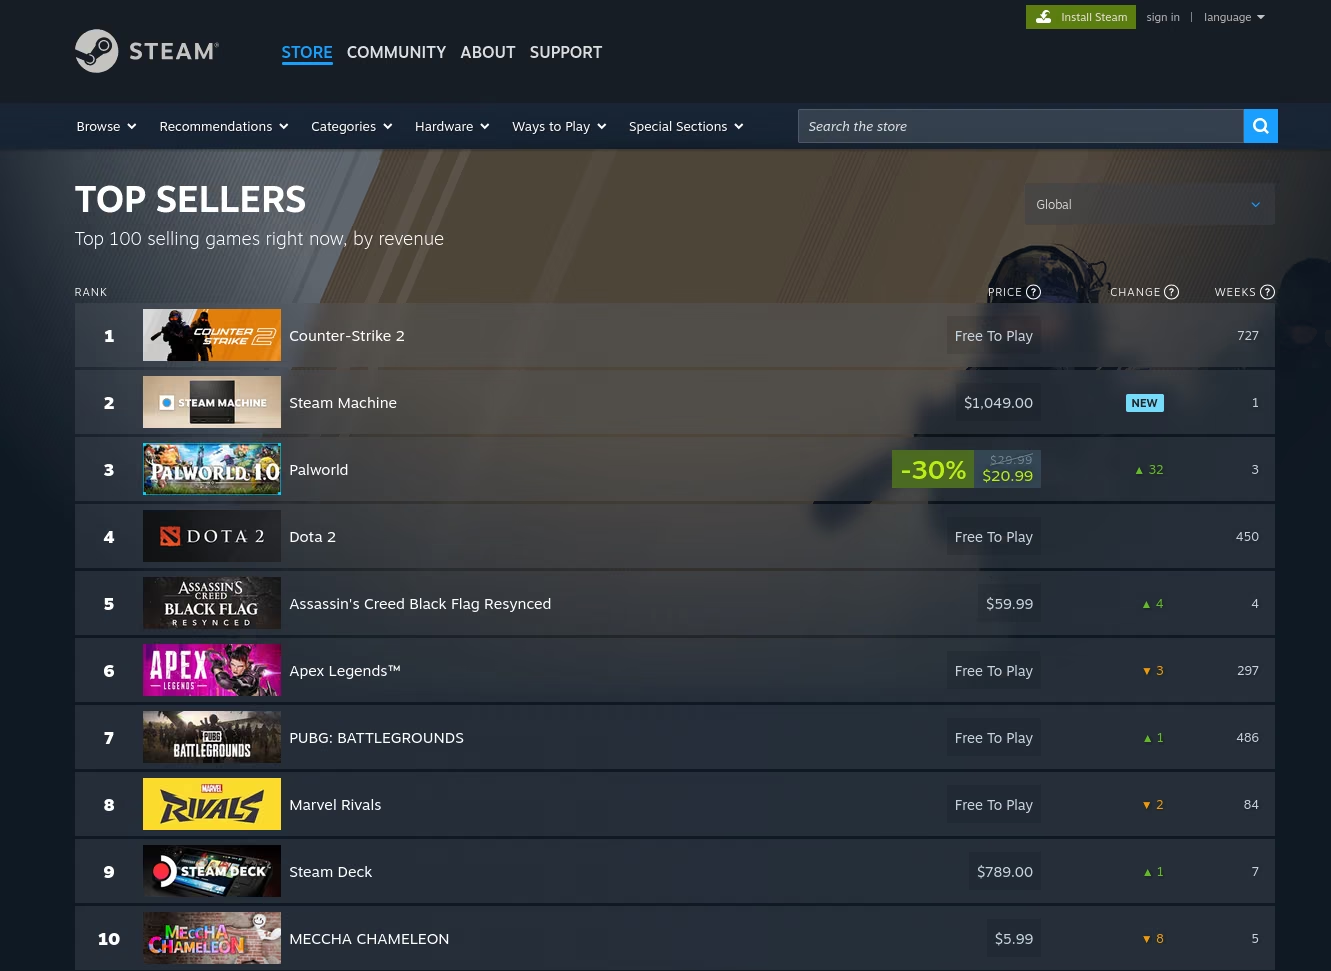
We can treat the number 1 and 3 as ceiling and floor for weekly gross revenue on the global chart.
The Ceiling: Counter-Strike 2 (Number 1)
CS2 functions as a permanent financial gatekeeper at the top of the list, driven by its fairly predictable revenue model. Aggregated data from GameDiscoverCo, Alinea Analytics, and VG Insights shows remarkably stable year-over-year throughput:
| Metric | 2023 Baseline | 2025 Performance |
|---|---|---|
| Annual Case Volume | ~360M | 400+ Million |
| Key Cost / Gross Revenue | $2.49 / around $900M | $2.49 / around $1.0B |
| Weekly Average (Keys + 15% MTX Fees) | around $17.3M | ~$19.2 to $20.0M |
When factoring in tournament stickers, Armory drops, and community marketplace turnover, CS2 gets a reliable weekly ceiling of USD 19M–20 Million. Of course, we should expect some up and down variation from week to week but this is a pretty good anchor.
Right now, the Steam Machine is not able to breach through the CS2 cash cow.
The Lower Floor: Viral Software Titles
Directly beneath the Steam Machine sits the active, popular software that goes up and down in the chart from one week to the next. This is a very dynamic area. During promotional windows or major update cycles, a title like Palworld (priced at ~$21 discounted) requires massive daily sales volume to maintain a top 5 position. Historical tracking indicates that clearing into Number 3 globally demands betweem 7 and 9 Million USD in weekly revenue.
This gives us a functional operating window for the Steam Machine’s current chart position:
USD 10M (conservative low bound) → USD 18M (aggressive high bound)
Now let’s see how we can translate that into sold units.
Deriving Unit Volume from Hardware Pricing
Revenue alone doesn’t tell us about physical throughput. We need to isolate pricing variables and consumer SKU behavior. The 2026 Steam Machine ships in two configurations:
- Base: 512GB NVMe SSD at $1,049 USD
- High-Tier: 2TB NVMe SSD at $1,349 USD
Historical hardware purchasing patterns on Steam show enthusiast buyers skewing toward higher storage tiers or optimal price-to-performance brackets. We apply a weighted distribution model:
65%adoption of the base configuration35%adoption of the high-tier configuration
Using that model, the average price paid for a typical Steam Machine customer should be around 1154 USD. Let’s not pretend we have high precision. We round it to 1150 USD.
Applying this against our revenue bounding box gives us three scenarios:
| Scenario | Revenue Target | Estimated Unit Sales |
|---|---|---|
| Low Bound | $10M | 8700 Units |
| Mid Bound | $14M | 12100 Units |
| High Bound | $18M | 15600 Units |
The medium point where the hardware is well above a typical 3rd position while maintaining a healthy buffer from CS2’s ceiling lands in the 12000–15000 units per week range.
Rolling Window Distortion: because of Valve’s 24-hour trailing window with the most recent 3-hour weighting, changes in timezone-based patterns or batch stock releases can elevate chart position during the week, artifically. There could be something like a 10% time-based margin of error in addition to the above estimations. Just be aware of that.
But all in all, we should not be that far off.
Context: Is that Good?
At more than 1050 USD, the Steam Machine isn’t a budget console competitor. My standpoint is clear: it’s bad value in light of what is available out there. But that does not mean that everyone shares my opinion. Ultimately the market will decide whether this is something desirable or not.
The Steam Machine is a living-room PC targeting gamers who like the SteamOS experience and who want something fairly small and plug and play. The estimated 12k to 15k weekly sales volume reflects the fact that this is not a mainstream home run. We are very far from mass-market volume that Nintendo or Playstation typically achieve at launch. On top of that, Valve may be constrained in the number of units they can actually ship, so there may be downward pressure on a higher demand. We don’t know for sure.
Let’s assume that this trend continues more or less at the same pace: we would see between 600k and 750k units sold on a 12-months basis. But many things can change: what if other competitive hardware becomes more expensive? what if Valve manages to decrease the price? What if sales campaigns make it cheaper for a short while and boost sales? The demand is typically fairly elastic with price movements. Right now, it’s not shaping to be a market failure, but rather a niche device. Realistically speaking, the demand is probably going to slow down naturally - it would not be surprising to see 20% or 30% less volume shipped per week after the initial launch period.
The thing to remember, however, is that PC hardware is not static. If new, more powerful and adequately priced hardware comes out in 2027, this will probably mean fewer sales for the Steam Machine, while Valve is stuck for a fixed hardware base for the foreseable future (the CPU/GPU combo is given).
Anyway, that’s a first data point, and we will be back down the road with new estimations as much as it makes sense. Stay tuned.